tests = (
    ([2, 1, 5, 6, 2, 3], 10),
    ([6, 3, 1, 4, 12, 4], 12),
    ([5, 6, 7, 4, 1], 16),
    ([2, 1, 3, 4, 1], 6),
)Largest Rectangle under a histogram
This is a popular coding interview question. It’s really simple with a simple histogram using pen and paper, but harder to think about in code, as it takes a bit of thinking through.
Detailed problem description: https://leetcode.com/problems/largest-rectangle-in-histogram/
A few test arrays with the largest area:
The arrays are visualized below, which makes it much easier to think about the solution. I found it easier to do it on paper first, before coding.
Code
fig, axes = plt.subplots(2, 2, layout="tight")
for ax, (arr, ans) in zip(axes.flatten(), tests):
    ax.set_axis_off()
    bar = ax.bar(
        range(len(arr)),
        arr,
        width=0.95,
        alpha=0.8,
        edgecolor="yellow",
    )
    ax.set_title(f"Largest rectange: {ans:2}", loc="left", fontsize=10)
    ax.bar_label(bar, fontsize=8)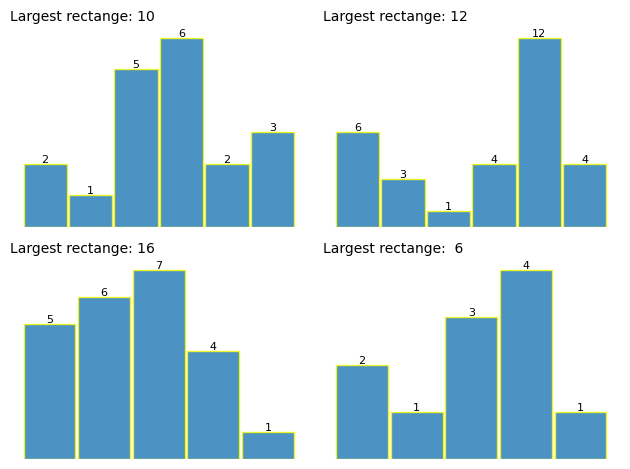
Looking at the array makes it easy to see where the largest rectangle might be.
A simple solution
We can brute force this by generating the largest possible rectangle at every item in the array.
For each N in the arry:
- find the left and right boundary of the largest possible rectangle
- this gives us the width, exluding the width of N itself (adding 1 to ad back N)
- so now we have the width, and the height is just the value N in the array
To keep things simple, first up a helper function which returns the rectangle boundaries of a given point in an array:
def find_boundary(idx: int, arr: list[int]) -> tuple[int, int]:
    """
    Example:
        idx 2 for [2, 1, 5, 6, 2, 3] returns (2, 3)
    Returns:
        (left, right)
    """

    # find left boundary (can be itself)
    left = 0
    if idx == left:
        pass  # deals with the left edge
    else:
        # march leftwards all the way to zero:
        for j in range(idx - 1, -1, -1):
            if arr[j] < arr[idx]:
                left = j + 1  # adding 1 to exlude boundary
                break  # exit loop once the first boundary found

    # find right boundary (can be itself)
    right = len(arr) - 1  # deal with the right edge

    if idx == right:
        pass  # at right edge already
    else:
        # march rightwards
        for j in range(idx, len(arr)):
            if arr[j] < arr[idx]:
                right = j - 1  # subtracting 1 to exclude boundary
                break

    return left, right
Phew! that should return the (left, right) boundaries for a given index and array. Using np.argmax should make this faster, but I wanted to see how it would look in pure python.
# testing this for the first arrary in the tests
for arr, ans in tests:
    print("array: ", arr)
    for i in range(len(arr)):
        print(f"Index {i}: (val {arr[i]}) - Boundaries: {find_boundary(i, arr)}")
    break
array: [2, 1, 5, 6, 2, 3]
Index 0: (val 2) - Boundaries: (0, 0)
Index 1: (val 1) - Boundaries: (0, 5)
Index 2: (val 5) - Boundaries: (2, 3)
Index 3: (val 6) - Boundaries: (3, 3)
Index 4: (val 2) - Boundaries: (2, 5)
Index 5: (val 3) - Boundaries: (5, 5)I drew the boundaries by hand for the first array to test the algo, and checked that the left and right values at each index are correct.
The find_boundary func is working, so now its easy to get the area of the max rectangle.
Finding the largest rectangle
The below function iterates through every item in the array, calculates the area of the largest rectangle at that point, and updates the max area function.
def max_area(arr: list[int], viz: bool = False) -> int:
    """returns the area of the biggest rectangle,
    and optionally returns its index"""
    max_area = 0
    max_idx = None

    for i in range(len(arr)):
        left, right = find_boundary(i, arr)
        # adding 1 to width as when we calc (right - left) it excludes itself
        width = 1 + right - left

        new_area = arr[i] * width
        if new_area > max_area:
            max_area = new_area
            max_idx = i

    if viz:
        return max_idx, max_area
    else:
        return max_area


for arr, ans in tests:
    assert max_area(arr) == ans
    print(f"Input: {str(arr):20} => Max Area: {ans:2} ")
print(f"*All {len(tests)} tests passed!*")
Input: [2, 1, 5, 6, 2, 3] => Max Area: 10
Input: [6, 3, 1, 4, 12, 4] => Max Area: 12
Input: [5, 6, 7, 4, 1] => Max Area: 16
Input: [2, 1, 3, 4, 1] => Max Area: 6
*All 4 tests passed!*That was pretty straight forward, though a bit verbose. Now an excercise in plotting this visually:
Eyeballing the largest rectangle
Using matplotlib to plot the largest rectangle - this helps explain why the answer better than a wall of text.
Code
# to use to show different rectangele with diff colors and fills
colors = list(mcolors.TABLEAU_COLORS.values())
hatches = ["/", "\\", "|", "-", "+", "x", "o", "O", ".", "*"]

fig, axes = plt.subplots(2, 2, layout="tight")
for ax, (arr, ans) in zip(axes.flatten(), tests):
    ax.set_axis_off()
    bar = ax.bar(
        range(len(arr)),
        arr,
        width=0.95,
        alpha=0.6,
        edgecolor="yellow",
    )
    ax.set_title(f"Largest rectange: {ans:2}", loc="left", fontsize=10)
    ax.bar_label(bar, fontsize=8)

    idx, area = max_area(arr, True)

    for i in range(len(arr)):
        if i == idx:  # got too messy plotting all the rects
            left, right = find_boundary(i, arr)
            width = 1 + right - left
            ax.add_patch(
                Rectangle(
                    (left - 0.5, 0),
                    width,
                    arr[i],
                    alpha=0.35,
                    facecolor="purple",
                    ls="--",
                    lw=2,
                    hatch=hatches[5],
                )
            )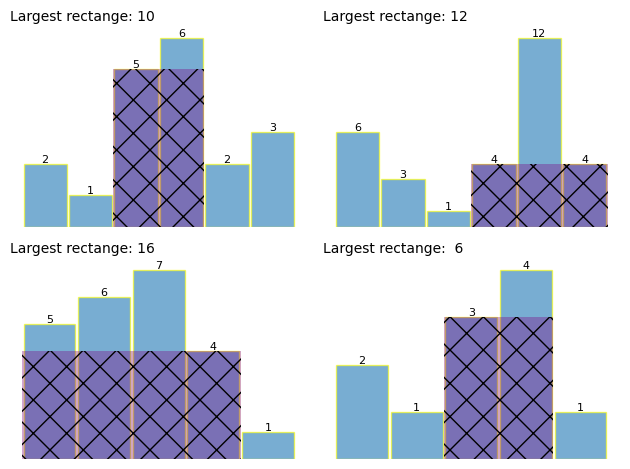
Every time I use matplotlib I’m both horrified and inmpressed by what you can do it… basically anything but so much code…
A faster, stack based solution
By using a stack, we can find the largest rect in O(n) time, as we don’t go through the array multiple times in this solution.
Instead of relooping through the array, we can use a stack to only go through the array once.
This algo:
- while the stack isn’t empty and the height of the current bar is <= to the top bar in the stack
- calc rect area, update if bigger
- rect height is the bar at the top of the array
- push current bar onto stack
- calc rect area, update if bigger
- the above loops end but leaves bars in the stack which only have bigger items to their right. Deal with this by:
- pop the stack, the height is that item, the width is the distance b/w that item and the right end of the array
- calc rect area, update max area
def histogram_max_area(arr):
    stack = [-1]  # the stop or sentinel value
    max_area = 0

    for i in range(len(arr)):
        while stack[-1] != -1 and arr[stack[-1]] >= arr[i]:
            current_height = arr[stack.pop()]
            current_width = i - stack[-1] - 1
            max_area = max(max_area, current_height * current_width)
        stack.append(i)

    # the remaining stack items rectangles extend all the way to the end
    while stack[-1] != -1:
        current_height = arr[stack.pop()]
        current_width = len(arr) - stack[-1] - 1
        max_area = max(max_area, current_height * current_width)
    return max_area


for arr, ans in tests:
    assert histogram_max_area(arr) == ans
    print(f"Input: {str(arr):20} => Max Area: {ans:2} ")

print(f"*All {len(tests)} tests passed!*")
Input: [2, 1, 5, 6, 2, 3] => Max Area: 10
Input: [6, 3, 1, 4, 12, 4] => Max Area: 12
Input: [5, 6, 7, 4, 1] => Max Area: 16
Input: [2, 1, 3, 4, 1] => Max Area: 6
*All 4 tests passed!*Even though the stack based solution is better, faster and smaller its tougher to comprehend than the simpler one above.