import numpy as np
import matplotlib.pyplot as plt

r = np.arange(0, 2, 0.01)
theta = 2 * np.pi * r

fig, ax = plt.subplots(subplot_kw={'projection': 'polar'})
ax.plot(theta, r)
plt.show()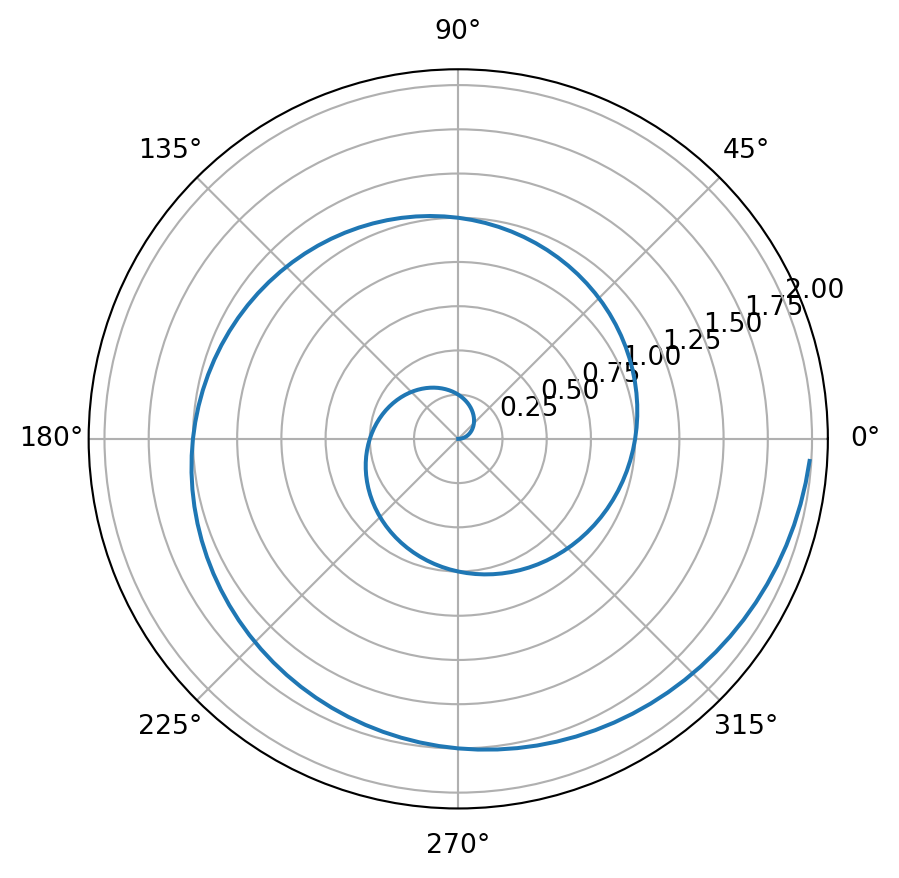
For a demonstration of a line plot on a polar axis, see Figure 1.
import numpy as np
import matplotlib.pyplot as plt
r = np.arange(0, 2, 0.01)
theta = 2 * np.pi * r
fig, ax = plt.subplots(subplot_kw={'projection': 'polar'})
ax.plot(theta, r)
plt.show()
import seaborn as sns
sns.set_theme(style="ticks", palette="pastel")

# Load the example tips dataset
tips = sns.load_dataset("tips")

# Draw a nested boxplot to show bills by day and time
sns.boxplot(x="day", y="total_bill",
            hue="smoker", palette=["m", "g"],
            data=tips)
sns.despine(offset=10, trim=True)
why isn’t quarto creating a _freeze directory? What stops it?